Access Across America: Auto 2015
About the study

This study estimates the accessibility to jobs by auto for each of the 11 million U.S. census blocks and analyzes these data in the 50 largest (by population) metropolitan areas.
Travel times are calculated using a detailed road network and speed data that reflect typical conditions for an 8 a.m. Wednesday morning departure. Additionally, the accessibility results for 8 a.m. are compared with accessibility results for 4 a.m. to estimate the impact of road and highway congestion on job accessibility.
Rankings are determined by a weighted average of accessibility, with a higher weight given to closer, easier-to-access jobs. Jobs reachable within 10 minutes are weighted most heavily, and jobs are given decreasing weights as travel time increases up to 60 minutes.
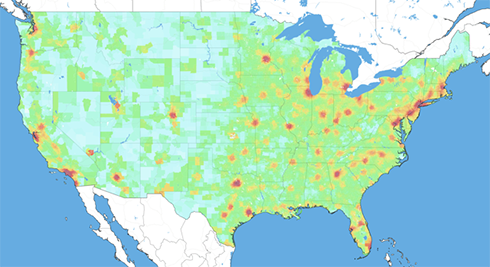
The report presents detailed accessibility and congestion impact values for each metropolitan area as well as block-level maps that illustrate the spatial patterns of accessibility within each area. It also includes a census tract-level map that shows accessibility patterns at a national scale.
Metropolitan areas with the greatest job accessibility by auto
- New York
- Los Angeles
- Chicago
- Dallas
- San Jose
- San Francisco
- Washington, DC
- Houston
- Boston
- Philadelphia
Areas with the greatest loss in job accessibility due to congestion
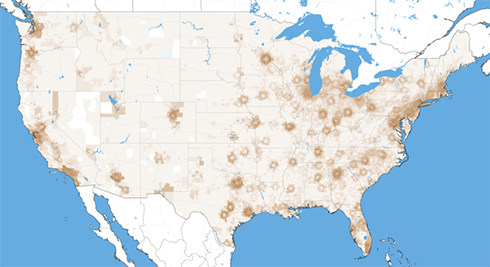
- Los Angeles
- Boston
- Chicago
- New York
- Phoenix
- Houston
- Riverside
- Seattle
- Pittsburgh
- San Francisco