Access Across America: Auto 2019 Accessibility Maps
The following maps show summary accessibility data and maps for each of the metropolitan areas included in the study.
The maps show 30-minute accessibility values at the Census block level. Lighter colors indicate few jobs can be reached within 30 minutes; darker colors indicate more jobs can be reached within 30 minutes. At the highest levels, millions of jobs are accessible by auto within 30 minutes.
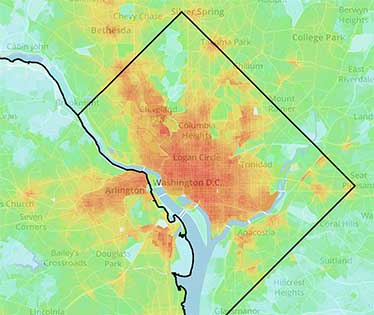
Accessibility map of Washington, DC
- Los Angeles
- New York
- Dallas
- San Jose
- Chicago
- Minneapolis
- Houston
- Detroit
- Phoenix
- Denver
- San Francisco
- Las Vegas
- Salt Lake City
- Philadelphia
- Milwaukee
- San Diego
- Washington
- Boston
- Miami
- Columbus
- Kansas City
- St. Louis
- Seattle
- San Antonio
- Baltimore
- Indianapolis
- Portland
- Atlanta
- Orlando
- Hartford
- Cleveland
- Austin
- Sacramento
- Cincinnati
- Raleigh
- Riverside
- Tampa
- Charlotte
- Louisville
- Memphis
- Providence
- Richmond
- Buffalo
- Oklahoma City
- Virginia Beach
- Nashville
- Jacksonville
- Pittsburgh
- New Orleans
- Birmingham